The four significant basic needs of life are food, water, clothing, and shelter. Interestingly, all these necessities are derived from agriculture and the earth’s natural resources. We do not need money to produce them. We just need our human labor, skills, and strength to provide these for every citizen of Ghana. As I pointed in Part 1, the materials for obtaining these basic needs to support our lives are freely provided by Mother Nature in abundance. So why should we live in poverty? Let us analyze these necessities one after the other, starting with food.
FOOD: we derive our food from plants and animals. Fortunately, our agricultural land is about 70% arable. This means that we have the agricultural capacity to provide more foods than the needed supply for national consumption. From the point of agricultural economics, we can start with maize and cassava considering the varieties of foods we get from them. We get so many varieties of banku, kenkey, and porridge, depending on the traditional, tribal, or cultural way of preparing it. Also, we get fufu, konkonte, and Gari among other plenty foods just from these two crops. It is an undeniable fact that we eat these foods on daily basis. The reason why we are starving is because we have hectares of agricultural lands unused, but not because we are poor. Maize and cassava grow in very large quantities within a short farming period. On the same platform of agricultural economics, a well-fed Sow can give birth to 10 piglets. This means that if the country starts with 100 sows, in about 4 months, through artificial insemination, we will have 1,000 piglets, on average. Mathematically, we can obtain millions of pigs in less than 5 years, under all favorable farming conditions. Poultry farming has the potential of yielding 50X output than the pig farming. This structural example is from an integral analysis that we have the agricultural resources to provide food freely to every citizen. Yes, it is possible that we can live in a country where food is free for everyone just like the air we breathe.
WATER: Water is not just a necessity of life but also an essential element for life. Why should we struggle for drinking water when we have lots of water bodies in Ghana? Desalination, a method of providing fresh water from seawater, alone can solve our water problem. We have the brains to fix our water problems, but we are acting too lazy. We should not lack drinking water when we have the Gulf of Guinea, Densu river, Pra river, Ankobra river, Volta river, Birim river, Ofin river, Sisili river, Tain river, Nini river, Mo river, Bonsa river, Bia river, Afram river, Atakora river, Tano river, Ayensu river, Daka river, Pru river, Sene river, Anum river, Kulpawn river, Weija reservoir, Todzie river, Oti river, lake Bosumtwi, lake Volta, White Volta, Black Volta, Red Volta, Aby lagoon, Keta lagoon, Sakumono lagoon, Songhor lagoon, Owabi dam, Tono dam, etc. We just need the brains to develop the technology needed for producing drinking water from these water bodies. The bottom line is that we don’t have to pay for water.
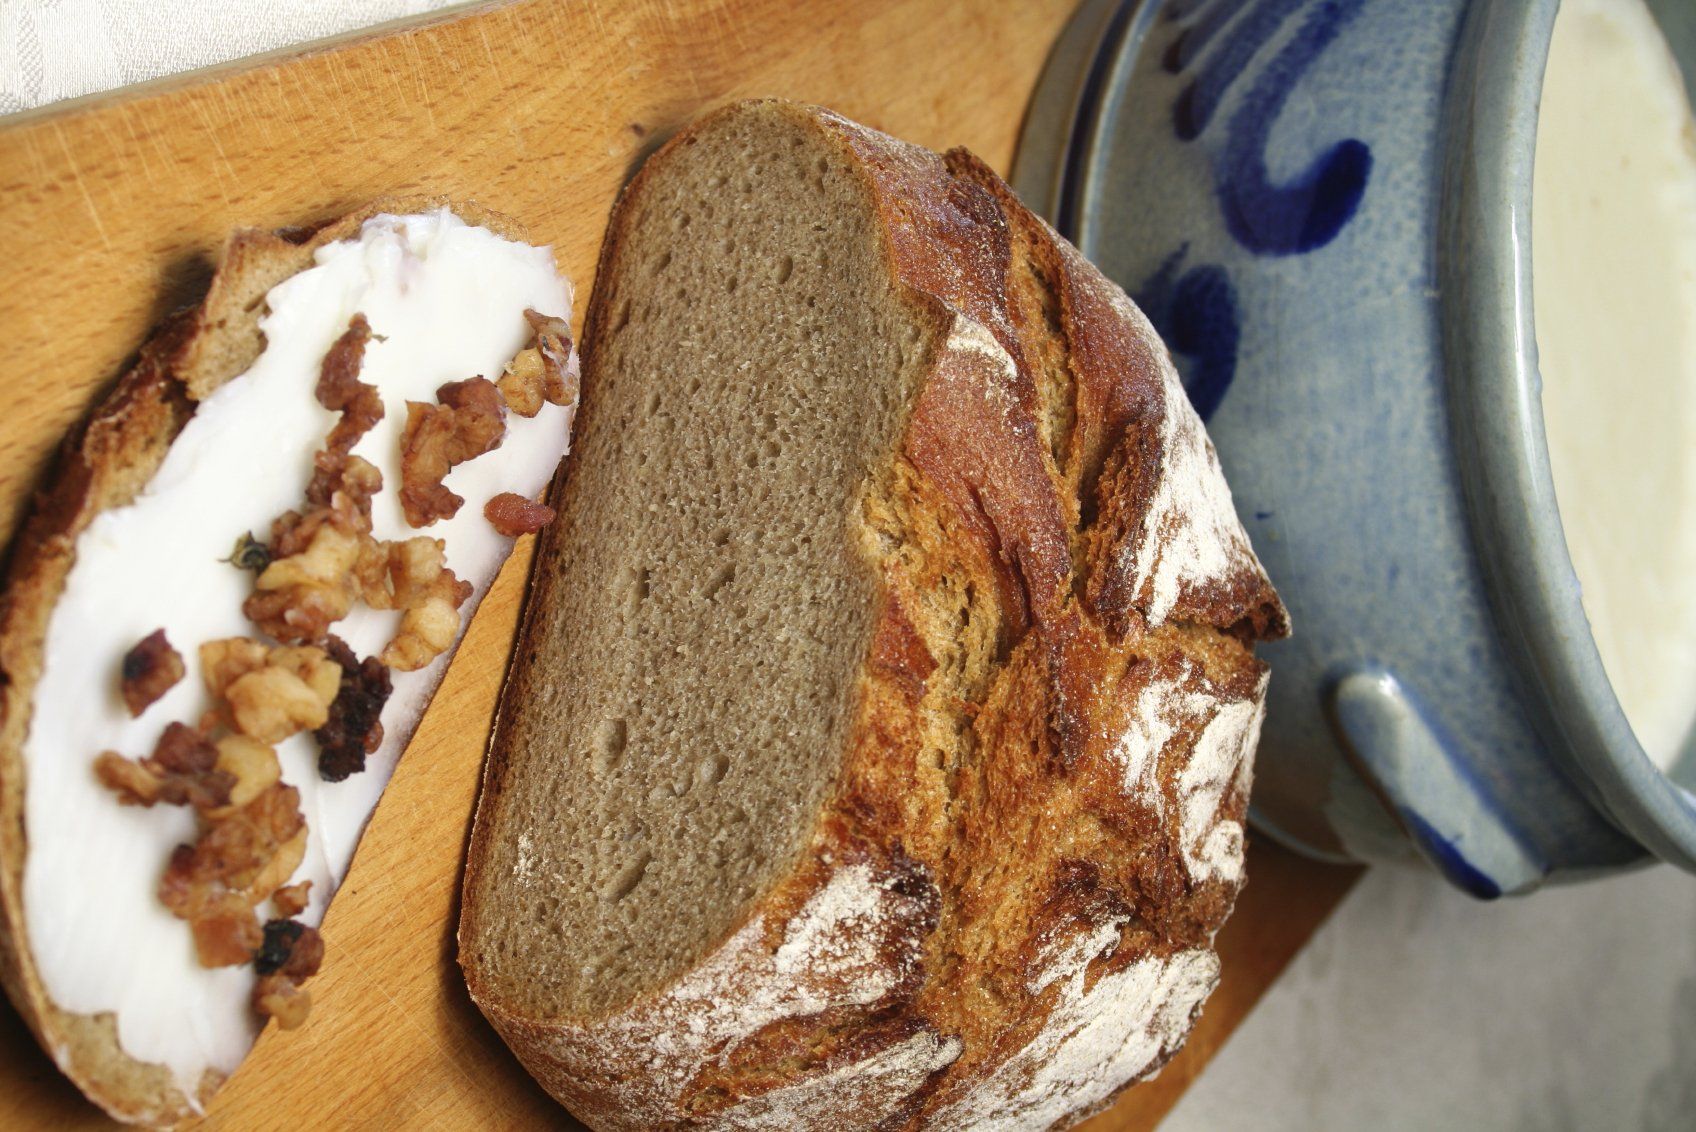
Clothing: Our shoes, sandals, bags, and clothes are made from agricultural products. Most common natural clothing materials are cotton, flax, wool, ramie, silk, and denim which are obtained from plants. Other materials are leather, fur, and down for down-filled parkas, all obtained from animals. Also, rubber, bamboo jute and hemp are plants that are used for making clothes. Reinforcing materials like wood, bone, and metal from natural minerals are used in fasteners or to stiffen garments. The materials used for making shoes and bags are mostly leather from animals, wood and rubber from plants, and metals from our natural minerals. Therefore, considering the fact that the materials for providing such necessities are renewable and can be produced abundantly from nature, we don’t have to lack them. As long as plants and animals reproduce, we should be able to have enough to cover everyone.
Shelter: the materials required for building any type of house are fabric, glass, granite, mud and clay, rock, thatch, brush, wood, sand, twigs and leaves, brick and block, concrete, mineral aggregate (sand and gravel), and metal [we even have diamond and gold in Ghana]. We have over 30 Hardwoods in Ghana; Afram, Albizia, Asanfina, Avodire, Black Hyedua, Ceiba, Dahoma, Danta, Denya, Ebony, Edinam, Emeri, Celtis, Guarea, Kaku/Ekki, Kane, Konkroma, Koto/kyere, Kusia, Mahogamy, Makore, Obaa/ohaa, Odum, Ofram, Otie, Papao, Potrodum, Tetekon, Walnut, Watapuo, Wawa, Wawabima, etc. Ghana has the woods for house construction, building boats, furnishing buildings, industrial floors, making plywood, timber mining, etc. You just name it, we have it all. We have rocks, sands, clay, and the metals for building and construction. As a matter of fact, we have all the resources abundantly.
All our necessities of life should be free for everyone. Paying for our necessities and basic needs will put stress, hardship, and burden on us. We are on earth to enjoy God’s creation. This is why He created and made provisions for all our necessities of life before creating the first man, Adam. Food, water, clothes, and housing should be free for everyone, through collective labor and population control. Greed and man’s desire for power and control is why we are enslaved and suffering. Do you realize that, in every society, the man who controls any of our necessities is rich, has power, and strong influence over the people? I will explain how, through collective labor and population control, we can make these necessities free for all in Part 3. Thank you for reading.
The Principle of Abundance and Recycling:
The Creator built our world on the principle of Abundance and Recycling; a seed from just one fruit is capable of reproducing hundreds of its kind, and the food-waste from animals goes back into the soil as fertilizer/manure. In some cases, we have had manures produce plants (without the seeds), when mixed with certain soils. Also, we have encountered situations where a special soil was obtained after grinding certain trees to powder form.
A Return to the Garden of Eden, A Ghanaian Perspective. [Part 1]
All the basic necessities of life are abundantly given by Mother Nature. The Air we breathe, water for supporting lives, plants for foods and medicines, animals for meats, and all the materials needed for constructing shelters are freely provided. So why are we suffering? The people who complain bitterly about the problems in our societies without offering any meaningful solutions are even worse than the problems. For example, when a “clueless adult” talks to ten children about our daily problems, he/she creates awareness in ten minds regarding our problems. Sadly, it becomes a chain reaction. This is why most Ghanaians know the problems and challenges facing the country, but lack the technical solutions to the problems. Politicians and public leaders are generally perceived corrupt and tagged as thieves, because the society is made to believe that they are the cause of our problems. Corruption is everywhere. “Man is made from dust” and as long as he eats, drinks, sleeps, and reproduces, he will forever be corrupt. The question, “why are we suffering?”, can only be answered when we gain full knowledge and understanding of the basic necessities of life, why they are very important, and how to create them. This is how we can return to the Garden of Eden and stay there permanently.
Lard is simply a pig fat in rendered [rendering is a process that converts waste animal tissue into stable, value added materials] and unrendered forms.Sources
This can be obtained from any part of the pig where there is a significant amount of body fat.Grades
Highest Grade: also called ‘Leaf lard’ is obtained from the fatty areas surrounding the kidneys and inside the loin. Usually, it has very little to no pork flavor, which makes it ideal for use in baked goods.
High Grade: this lard is obtained from the fatback, referred as the hard subcutaneous fat between the back skin and the muscle of the pig.
Low Grade: this is obtained from the soft caul fat surrounding digestive organs, such as small intestines. Caul fat is often used as wrapping for roasting lean meats or in the manufacturing of pate [a mixture of cooked ground meat and fat minced into a spreadable paste].
Rendering Types
Wet: the wet process of rendering lard is by boiling the pig fat in water or steaming it at a high temperature. The lard, which is insoluble in water, is skimmed off the surface of the mixture or separated in an industrial centrifuge.
Dry: in dry rendering, the fat is exposed to high heat in a pan or oven without the presence of water.
The difference is that the Wet-rendered lard has a more neutral flavor, a lighter color, and a high smoke point. On the other hand, the Dry-rendered lard is a more browned in color and flavor, and has a lower smoke point.Uses
Useful for cooking because it produces little smoke when heated and has a distinct flavor when combined with other foods. It’s often preferred over other types of shortening due to its flavor and range of applications. Rendered lard can be used to produce biofuel and soap.Benefits
Has a fantastic flavor.
Has range of applications than the others.
It has less saturated fat than butter.
Gives fried chicken and roasted vegetables a better taste.
Does not impact a pork flavor.
It is sustainable
Has one-fourth the saturated fat and over twice the mono-unsaturated fat as butter.
It is low in Omega-6 fatty acids, known to promote inflammation.
Pig milk is the milk naturally produced by pigs. By composition, it is very similar to that of a cow. A pig milk contains a fat percentage of 8.5 as compared to 3.5% of fat in cow’s milk. This means that, in percentage wise, a pig milk has a fat of 5% more than a cow’s. Despite the small difference in fat percentage, mathematically there is approximately 59% change in fat composition [((8.5-3.5)/8.5) x 100%] although they are different biological species. The production difference in pigs is that pigs with high intake of protein-consumption produce more milk than pigs on low-protein diets. Also, the level of colostrum, in terms of protein, fat, and lactose is about the same in cow milk. But pig milk is more watery than that of a cow’s. And compared to goat milk, pig milk is more gamy [gamy: has a strong flavor or smell of the animal, i.e the pig in this case.
PIG MILK CHEESE
Pig milk cheese is a special delicious cheese made with pig milk.
HEALTH & BEAUTY
It is pointed out that Susanna Montgomery, the Countess of Eglinton, used to wash her face with pig milk and drink it. Historically, she made strong recommendation of it to others with the believe that it would help retain one’s figure and complexion.
Pigskin also commonly referred to as Berkshire or Boarskin is a leather fabric made from a pig’s skin. The patterns of pigskin in the market can be finished, tanned, raw, wet salted, dry salted, embossed, printed, coated, polished, and wet blue. These are grouped into two types; Grain and Split.
A Split Leather (Suede): the first leather removed from the hide of the pig is extremely thick. Therefore, the leather must be split cross-sectionally into layers. The bottom layer is made into what is called “split-leather”.
Advantages of Split-leather:
High abrasion resistance due to its dense fibers and ability to lock together
Has great puncture resistance
More water resistant than grain leather
Grain Leather: is the top layer of the leather after it has been split apart.
Advantages of Grain Leather:
More expensive than the split-leather which means the farmer makes more money.
It is often used in the areas that receive more wear since its fiber is thicker and more compact than that of split-leather.
Properties of Pigskin, compared to the leather fabric of other animals
Very soft and breathable
Flexible
Durable and strong
Water and moisture resistance
Pliable
Oil and stain repellent
Uses of a Pigskin
Industrial Use:
Gloves: – palm gloves, security gloves, general working gloves, construction gloves, cooking gloves, driving gloves, protection gloves, etc.
Leather jackets
Shoes and shoe linings
Garments
Footballs
Bookbindings
Wallets and purses
Bags
Furniture/sofa
Belts
Car seat covers
Hats
2.Medicinal Uses
Collagen: this is the most abundant protein in human bodies. It is found in the muscles, bones, skin, and other places in animals. It helps give the skin strength and elasticity, along with replacing dead skin cells. Exogenous collagen [collagen from external/outside source, such as getting it from the pigskin] is used for medical and cosmetic purposes, including the repair of body tissues, as well as skin beautification.
Gelatin: is a mixture of peptides and proteins produced by partial hydrolysis of collagen extracted from the skin, bones, and connective tissues of animals such as domesticated cattle, chicken, pigs, etc. It supports skin, hair and nail growth, among numerous health benefits.
Replacing skin of burn victims: researchers are now using pigskin and miniatures inbred pigs in human transplant, neural developments, and plastic surgery.
There are so many useful things to derive from pigskin. Maybe a thorough research will enable us to discover more . So, technically, one could have a ball, boot, leather pant, leather jacket, bag, wallet, and a hat from just a pigskin. Hmm! very interesting. This shows that after all, ‘swagging’ isn’t that expensive.
Disliking Pork on the grounds of Islamic [Quran] Laws
The Quran does not point to any concrete religious reason for prohibiting pork. As a matter of fact, in the entire Quran book, the instruction is given once, in 2:173 and backed in 5:3, 6:145, and 16:115. In summary, Surah al-Baqarah 2:173, Surah al-Md’idah 5:3, and Surah al-Nahl 16:115 warn that “He [Allah] has only forbidden to you dead animals, blood, the flesh of swine, and that which has been dedicated to other than Allah. But whoever is forced by necessity, neither desiring it nor transgressing, there is no sin upon him. Indeed, Allah is Forgiving and Merciful”. (Quran :173). Emphatically, the Quran points out in 6:145 that the prohibition is strictly made to ensure that people maintain good health. It is a matter of common-sense to understand why dead animals are not to be eaten.
The people at that time had no proper veterinary service and medical knowledge to understand the nature of certain strange animal diseases. We do know that when an animal dies of a disease, there is a higher tendency that people who consume the animal’s meat might contract the same disease. Similarly, Surah al-Ma’idah 5:3 includes the prohibition of animals devoured by beasts or preys. The health-base explanation to this prohibition is that certain animals have poisonous attacking mechanisms that they use on their victims.
Also, animals that sustain cut injury or open wound during attack or in a fight may be exposed to infections. Whether infected or poisoned, eating such animals will result in a dire health. These are part of the reasons why such prohibition is made. As discussed in part 2, the pig was prohibited because of its inability to chew the cud. And we can understand from it that the whole law on food selection is for the betterment of our health.
The Quran reiterates that “whoever is forced by necessity, neither desiring it nor transgressing, there is no sin upon him” to assure us that there is no religious curse on eating a pig. My interest is in the phrase “forced by necessity”. Necessity, by definition, is an indispensable thing or the fact of being required. Considering the rate at which our population is increasing, we need farm animals that have the physical capacity to withstand adverse environmental and agricultural conditions, and with the ability of reproducing many offspring within a brief period to help us reduce hunger and starvation in our country. Pig is agriculturally economical and has proven to solve food crisis in the advanced countries.
It is high time we start thinking constructively for the betterment of our lives, instead of being slaves to some laws that were written thousands of years ago to guide people who could not reason for themselves.
It is really a shame to term this food “haram”. There are thousands of children in the northern parts of Ghana that need to be saved from hunger and starvation. Together, we can do better for Ghana. We should change our primitive way of thinking and be rational, if we want to develop in every aspect of life.
Disliking Pork on the grounds of Christian Doctrines
We Christians quote God’s command in the Bible as the reason for not eating pork. Emphatically, the book of Leviticus 11 and Deuteronomy 14:7-8 are often quoted as the reference points for our stand against having anything to do with pig. We highlight on the fact that God considered the pig unclean and instructed the people at that time to refrain from eating it. Biblically, Deuteronomy 14:7-8 and Leviticus 11: 4-8 issue the same warning: “the pig is also unclean; although it has a divided hoof, it does not chew the cud. You are not to eat their meat or touch their carcasses”. From these texts, we can deduce that the instruction was centered on the CUD. Why was the CUD used as a factor and element for classifying pig an unclean animal? To answer this, we first need to understand what a CUD is, and its effects on animals.
A CUD is a partly digested food returned from the first stomach of ruminants to the mouth for further chewing. Basically, it is just a portion of food that returns from a ruminant’s stomach to the mouth to be chewed for a second time. This is specifically done to enable proper digestion of the food. Cud chewing is important because the foods animals eat could be difficult to digest and takes extra effort to absorb all nutrients from the food.
Literally, ruminants like cows, goats, and sheep will not chew the cud if we break their food into the simplest form before feeding them. For example, if we grind grass to a powder form and feed it to ruminants, their rumen muscle will not send any part of the food back to the mouth for rechewing because the food has already been broken down.
According to history, ancient farmers allowed animals to feed for themselves, under their supervision. The farmers will take the animals out in search of food and water. So, the need for a structural law to guide people on what meat to consume was because the farmers were not regulating or controlling the foods of the animals. Hence, the need to make the law from the perspective of the animals’ feeding system, to keep people [consumers] healthy and safe from diseases.
The second part of the law, in reference to the “divided hoof”, was based on the biological nature of the animals. The chemicals that coordinate the biological make-up of the physical body of one animal could be a poison in another animal, when consumed. The pig made the cut and is exempted from this aspect of the law because it has a divided hoof. This literally means that a pig that feeds solely on simplest broken-down organic food is equally a clean animal.
In comparison, this is just like us, Christians. Per the Old Testament of the Bible, God specifically warned, instructed, and commanded the Jews not to have anything doing with the gentiles. This is because all nations, in exception of the Jews, were regarded as evil and filthy before the Almighty God. Then Jesus Christ came to wash away our sins, renewed us, and taught us the ways that please God. Practically, a reference to this account is recorded in Acts 10 when God taught Apostle Peter not to refer to any gentile as an unclean being again.
So, to all my fellow Christians who quote the Bible as a reference point for disliking pig, I will strongly advice that you reconsider your stand from a common-sense perspective so you don’t make a mess of yourself among rational people.
The study was
to assess the situation of fuelwood harvesting on the livelihood of rural
households in Moyamba District southern Sierra Leone. With such the specific
objectives were; To
determine the extent of fuelwood harvesting among households in the research
area. Assess the Knowledge of rural households on the climate issue. The extent
to which household access climate change-related extension services in the
research area. The communities were selected purposively.
The respondents were selected randomly. One hundred and fifty respondents were
surveyed. The study revealed that 63.3% of the total population does not access
extension services. 53.3% of the total population harvest fuelwood for firewood
every week. On the average households are spending 11 more minutes rep trip now
to collect fuelwood, this shows that deforestation is on the rise. The study
recommends that extension workers should receive training on climate change-related
issues. Besides, other alternatives for cooking should be made available to
rural households.
Key words : firewood
,livelihood ,household , natural
resources , income generation ,consumption ,population ,alternatives etc
INTRODUCTION
Agriculture
is an important sector in developing countries in general and Africa in
particular (Makonnen et.al, 2015). People living in such countries are also
heavily dependent on natural resources such as fuelwood for their livelihood
when natural resources are degraded rural households respond in different ways
to cope with the scarcity of the resources. Among several options, these
households use their labor to cope with the increasing scarcity of natural
resources.
Globally,
fuelwood is the principal energy source for over 2 billion, primarily poor
people (Sangay, 2011) and fuelwood harvesting accounts for over 54 % of total
annual wood removal from forests. Approximately 1.7 billion of fuelwood and
charcoal were produced globally in 2004(Wangchuk et.al 2013). And wood-based fuels comprise about 80 % of
total household energy consumption and 35 % of total energy use in developing
countries.
Wood harvesting is the third most important
economic activity for the inhabitants of the forest-dependent area, after
farming and animal husbandry (Yunana, 2013). In the past, wood harvesting in
developing countries was mainly for domestic consumption, and it was mostly
women who gathered the dry branches and trunks of trees and shrubs for fuelwood
(Awah 2005). Today the situation has changed, increased commercialization of
the sector has led to
the widespread
harvest of both dead and live branches and trunks by men and women.
The majority of forests, by their very nature,
are located within rural and frequently remote areas. Typically this means that
such areas are underdeveloped in terms of infrastructure, government services,
markets, and jobs. It is not surprising, therefore, that communities living in
and adjacent to savannas and forests are characterized by seemingly high levels
of poverty and limited livelihood opportunities (Shackle ton, 2004). Rural households are highly dependent on forest
resources for subsistence foods and materials as well as for cash income. Over
90% of rural households depend on forests to meet their household energy
requirements.
The
total extraction of wood and non-wood forest products average 30.6 % of the
total household production per annum (Bwalya,2011).
The
forest sector in Africa plays an important role in the livelihoods of many
communities and the economic development of many countries. This is
particularly so in Western, Central, and Eastern Africa where there is
considerable forest cover. Africa has a high per capita forest cover at 0.8 ha
per person compared to 0.6 ha globally (Sebukeera et.al, 2005).
In Africa and many developing countries, there
is an inextricable link between the forest resource and the livelihoods of the
rural communities. More than 80% of the rural population in sub-Saharan Africa
is poor and traditionally relies on forests for most of their livelihoods
including fuelwood and timber as well as other non-timber forest products and
Fuelwood provides the main source of the total household energy requirements in
Africa with the consumption varying from country to country for example 85% in
Mozambique, 76% Zambia, 91% Tanzania and 14% in South Africa (Kalaba, 2010).
It is clear that in the short and medium-term
wood, complemented by farm residues, will remain the only affordable fuel for
the majority of the population in West Africa. There is also no doubt that this
great demand for fuelwood and charcoal exerts considerable pressure on the wood
resources of this country, giving rise to serious and widespread concern on the
sustainability of supply of wood energy with a demand for charcoal that covers
up to 70% of the entire national requirement for such commodity (Drigo et el,
2013).
Fuelwood is almost
certainly the earliest traded forest commodity in Sierra Leone. Before even the
establishment of the Freetown settlement, in the 17th century passing European
ships frequented the Freetown peninsula to purchase firewood bundles (among
other items) from the Temne and Sherbo communities living there (Munro, 2011). He
further states that Historical records suggest that soon after the initial
settlement and growth of Freetown, much of the town’s firewood supplies started
to come from outside the Peninsula area. During the same period, the colonial
government also put out its tenders for firewood, inviting applications to
supply mangrove wood for public buildings. As Freetown continued to grow, the
railway became important for supplying the city with firewood from medium to
long distances, especially before World War Two. While firewood was mostly sold
informally by hawkers around Freetown at this time there were at least two
official depots on Freetown’s waterfront in 1939 selling the commodity (Munro
et.al 2011). Firewood also had some limited commercial value in other urban
centers in Sierra Leone during this period. As well, it is likely that other
larger centers such as BoTown and possibly Kenema Town also had some modest
commercial trade in firewood during this period (Munro, 2011).
After Sierra Leone 1991-2001 civil war, the
trade-in firewood became increasingly commercialized, with large numbers of
villages near highways or urban centers becoming involved in harvesting and commercially
trading the commodity.
However, Overall Bo and Kanama towns have the
most complex markets in the southern region of Sierra Leone. Bundles of
fuelwood are sold at various price points between Le 200 and Le 5,000 depending
on the size and number of the sticks in the bundles (Kebbay,2011).
In Bo Town, the
smaller vendors bring their supplies on foot from their farms (usually around
30 to 40 medium-sized bundles per month) and mid-size larger vendors hire
others to carry their supplies (usually around 80 bundles per month) while the
largest vendors hire trucks to bring in around 100 to 200 bundles per month.
There are a couple of very large scale vendors in Bo town that truck in over
500 bundles each month. In contrast, all vendors in Kanama town tend to operate
at a medium scale, hiring trucks to bring in 40 to 50 bundles of firewood each
month (Kondey2011).
Similarly, the
vendors operating in Moyamba town and Kailahun town are simply residents of
nearby villages who bring supplies from their farms each day (around 30-40
bundles a month) and sell them for between Le 500 – 2,000 (Kpagoi, 2011).
Rural household in
southern Region of Sierra Leone procure a wide variety of products from
forest
resources to meet their basic needs for food security (Shackleton, 2000). They
are also important natural assets for rural households, providing both
subsistence and market-oriented livelihood strategies. For example, in
south-eastern of Sierra Leone, the average value of woodland goods collected
was observed to be 30% of the average gross cash income per household per year
(Campbell et al., 2002). The expanding commercialization of many woodland
products also provides rural households with a range of market-oriented
woodland livelihood opportunities (Serra et.al, 2003). The harvesting of
woodland products is widely recognized as an integral component of the rural
livelihoods throughout the Moyamba District, offering goods for both household
consumption and income generation. The primary factors influencing household
energy consumption are the number of individuals in the household and household
income (Sangay, 2011).
STATEMENT OF PROBLEM.
The Southern Region of Sierra Leone is the most
forested area in Sierra Leone.
There is numerous problem associated recently in
this part of the country due to the lack of knowledge of the effect fuelwood
harvesting cause on the livelihood of rural household in Moyamba District. Some
of this problem facing recently is the heavy involvement of rural people in
deforestation which have to affect agricultural activities by exposing the soil to erosion that
lead the soil to lost of nutrient and fertility that contribute to the low output of crops. It has reduced the watershed
areas and cause pollution in the environment that has resulted in the greenhouse
effect.
The continues harvesting of fuelwood in the forested
areas has also signaled a negative impact on the tourist attraction because
most of the Animal that is usually found in these forests have been forced to
migrate to another part of the country. It has also affected the planting time
for most farmers because they have used to determine it by the weather
condition.
AIM AND SPECIFIC
OBJECTIVES OF THE RESEARCH
Aim
This research aims
to assess the effect of fuelwood harvesting on the livelihood of rural
households in Moyamba District, Southern Sierra Leone.
OBJECTIVES OF THE RESEARCH
The Objectives of the research are as follows.
To describe the Characteristics of rural
households that depend on fuelwood harvesting in the research area.
To
determine the extent of fuelwood harvesting among households in the research
area
3 Assess the Knowledge of rural households on
climate issues.
4.
The Extent to which household access extension services in the research area
RESEARCH HYPOTHESIS
The study will be
carried out by testing the following hypotheses
HO: There is a significant effect of fuelwood
harvesting on the livelihoods of rural households in the Moyamba District.
HA: There is no
significant effect of fuelwood harvesting on the livelihood of rural households
in the Moyamba District.
JUSTIFICATION
OF THE STUDY
Human livelihood
in most rural areas in Sierra Leone is highly dependent on farming activities,
but the subsistence form of Agricultural practiced by rural farmers can barely
feed themselves and their immediate family members. People hence seek for other
complementary alternatives. One such alternative has been fuelwood harvesting
mostly for charcoal production.
Additionally, the
increasing demand for this product has led to an increase in the quantities
harvested. Dramatic changes have been occurring on human livelihoods, in terms
of socio-cultural and economic parameters. Despite these changes, no know
publication has based its research on the impact of fuelwood harvesting on
human livelihoods of residents of Moyamba District in Sierra Leone. It is
therefore relevant to conduct research that will reveal relevant results and
recommendations that will greatly impact the research world, farmers, and
decision-makers.
SCOPE
OF THE STUDY
This study was conducted
mainly in Kori, Kamajei, and lower Banta chiefdom because there is massive
harvesting of fuelwood in those areas. According to the study the following was
of our target we investigated; Characteristics of a rural household, the extent
of fuelwood harvesting, knowledge of rural household on climate change, and
household access to extension services.
LIMITATIONS
There were limitations
encountered during the study. These were; Respondent was not will to divulge
information: some respondent is reluctant to respond to the interview schedule
because a lot of their time had been wasted in the past by researchers on
interviews without any perceived benefits. These problems made it necessary for
the researchers to work through some stakeholders so that they will discuss it with
me. Getting respondents for questioning: it was also difficult to get the respondent
to spear their productive time or leisure time for questioning. they were
either very busy taking-off for a farm in the morning or very tired in the
evening after a whole day work on their farms. This, therefore, put heavy
pressure on data collection to approximately adjust to the respondent’s daily
schedule and interviews them when it was convenient.
METHODOLOGY
Description of the study area.
Moyamba
District
This study will be conducted in the Moyamba
district. Moyamba district on the other hand borders the Atlantic Ocean in the
west, both Portloko and Tonkolili districts to the north, Bo district, and
Bonthe district in the south. Moyamba District is a district in the southern
province of Sierra Leone, with a population of 260,910 in the 2004 census. It’s
the capital and the largest city in Moyamba. The other major towns include;
Njala, Rotifunk, and Shenge. The district is the largest in the southern
province by geographical area, occupying a total of 6,902km (2,665sq miles) and
comprises fourteen chiefdoms.
The main economic
activities including mining (retile and bauxite), fishing, rice growing, and
oil palm production. The dominant ethnic groups in the district are the Mende,
Shebro, and Limba
Research Design
The research
design used for this study will be a non- experimental design. The simple form
of non- experimental design is a statistical survey. This design is considered
appropriate for this research because of the nature of the objectives and the
type of data will be collected which is descriptive. Its weakness is usually
minimized through appropriate survey methods using randomization and proper
data collection instrument by:
Ensuring that the questions to be answered
are clear and not misleading
Getting respondents to answer questions
thoughtfully and honestly
Getting a sufficient number of
questionnaires completed and returned so that meaningful analysis can be made.
Source of Data
The data for this
study will be collected from one main source. I.e. the primary data were the
farmers will be contacted.
Population sample Size and Sampling Procedure
Population
The
population for this study comprises of the household of selected chiefdoms in
Moyamba
District
Sample Size
The sample size for this
study was determined to base on Yamane (1967) sample size determination
procedure. Using this procedure, a total of 150 households was selected from
among the total population
Sample
Procedure
A two-stage sampling
technique was used to select the sample respondents. The first stage was the
purposive selection of the project area. The second stage was also the
selection of the respondent. A sample random sampling technique was used to
select a total number of one hundred and fifty (150) as a sample for the
survey.
Data
Collection
A survey questionnaire
was chosen for the collection of information from the farmers for this study to
achieve the study objectives. This study preferred questionnaire because of the
ease of administration and scoring, besides the results being readily analyzed.
The items on the questionnaire were developed based on the objectives of the
study, Observation methods were also used by looking at the quantity of
fuelwood they harvested pa day. The questionnaire was tested to check its
contact, construct, and face validity. Contact Validity ensured that the
content of the instrument contained an adequate sample of the domain of content
it represented. Face validity looked at the format of the instrument that
includes aspects like the clarity of printing, font size and type, adequacy of
workspace, and appropriateness of language among others. Construct validity
determined the nature of the psychological construct or characteristics being
measured by the instrument. The research supervisor and two other experts in
measurement and evaluation were also consulted to help in review to ensure the
instrument accurately measured the variables is intended to measure in the
study. To ensure the reliability of the instrument, the pre-test methods were
employed. By the pre-test methods, it means the instrument was administered on
a pilot sample of an interval of two weeks between first and second
administration. The instrument was administered to the household by the
researcher himself. An appointment for the administration of a questionnaire to
the respondents was booked with the assistance from village elders. The
instrument was administered to the household by enumerators to collect the
required information and their responses recorded accordingly. The study
focused mainly on household heads for the survey questionnaire to cater for
uniformity of the data collection process.
Data
Analysis
The Data collected was entered
and analyzed by simple descriptive analysis and Econometric models using
statistical package for social scientists (SPSS) version 16 software. The
software was chosen because it is the most used package for analyzing survey
data. The software has the following advantages: it can easily be used to
analyze multi-response questions, cross-section, and time series analysis and
cross-tabulation;(i.e. relate two sets of variables) and it can also be used
alongside Microsoft excel and world.
Descriptive
Statistics
Descriptive statistics
such as frequency counts; percentages, proportions, and means were used to
analyze the data. Frequency tables and figures were developed to display the
results obtained from the research analysis.
PRESENTATION OF RESULT AND DISCUSSION OF
FINDINGS
The results of this study
are presented and discussed in this chapter. The interpretation is based on the
set objectives. Findings were also explained in the context of related studies
and reviewed the literature
Characteristics of rural households
One of the objectives of
this study was to determine the characteristics of households in kori, kamejei,
and lower Banta on the effect of fuelwood harvesting on the livelihood of rural
households in the moyamba district.
Gender of respondents
Gender may determine what role men and women play in the development programs in rural communities. It also dictates which technology to design for any particular community. Hence, the gender situation in the study area was investigated and the results are presented below Gender distribution of respondents
Source: survey 2015
Figure
1.Showing Gender distribution of respondents in the study area
Figure 2: shows that
59.3% of the respondents interviewed were male and 40.7% were female. This
reveals that in the study area, the male gender is the highest participants in
fuelwood harvesting
Age of Respondents
Age is a measure of
maturity and determines the rate of an individual in any society. Literature
tends to suggest that it also determines the adoption capacity of the
individual. The age distribution of respondents is presented in figure 3
Age distribution
of respondents
Source: Survey
2015
Figure
2: Age Distribution of Respondents in the Study Area
Figure 2: Shows that the
average age of the respondents was 31 years old. However, the age varies from
15 and 78 years, with the highest concentration being in the age bracket of
(50.0%). This represents the active group in fuelwood harvesting it is clearly
shown that fuelwood harvesting was in the middle age class. This has a positive
bearing on their ability to harvesting fuelwood.
Marital status of the respondent
Marriage confers the status
and responsibility of the individual. Usually, a person’s marital status is
considered relative to his or her social status, level of responsibility, and
moral behavior.
Marital Status of
Respondents
Source: survey
2014
Figure
3: Distribution of respondent showing marital status in study Area
Figure 3: the
marital profile of the respondent showed that about 82.7% were married,8.7%
single,4.7% divorced, and 4.0% widowed. The 83.7% of married have an impact on
the household to produce not only for sale but to feed his family. This was
expected to have a positive effect on fuelwood harvesting on the livelihood of a
rural household since He/she needs to feed more mouths.
Academic Level of Respondent
Source: Survey
2014
Figure
4: Academic level of Respondent in the study area
Figure 4: The level of
awareness and adoption of the effect of fuelwood harvesting are affected by the
literacy status of farmers. But according to literature, the sustainability of
agricultural production is largely dependent on the action of the farmers and
their decision making abilities given the level of knowledge and information
that is available to them(Rahman,2003).50.0% of the household heads did not go
to school at all while 27.3% were fortunate to acquired secondary school
education,17.3% attained primary school level, 4.7% tertiary education and 7%
attained Arabic education.
Head of Household
Figure
5: Household Head of Respondent in the study area
Figure 5: Among
the respondents that were interviewed 55.3% were household heads of their
family and 44.7% could either be wife, son, sister, mother-in-law,
father-in-law, etc. An increase in the number of household heads tends to
encourage them to divert from fuelwood harvesting.
Size of Household
SIZE OF
HOUSEHOLD
Source:
survey 2015
Figure
6: Showing size of households of respondents in the study area
Figure 6: shows that56.7%
of the respondents had 8-13 household members with the highest majority, 38.7%
of the respondents had 2-7 household members with the second majority.4.0% of
them have 14-19 household members and 7%
have 20 upwards household members downwards
Relationship with the household head
Source:
survey 2015
Figure
7: showing the Relationship with the household head in the study area
Figure 7: Among
the respondents that were interviewed 18.0% were the wife of household
heads,5.0% was the son of household heads,9.3% daughter of household head 9.3%
could either be sister, mother-in-law, father-in-law, tenant 58.0% not
applicable means they are household head and the question is not relevant to
them. Source of
livelihood
Source:
survey 2015
Figure
8: Showing the source of your livelihood in the study area
Figure 9:The data
clearly show that 90.0% of the respondent depend on fuelwood harvesting and
agriculture, 5.3% of the respondent are fuelwood dependent and 4.7% are
fuelwood harvesting and non-agriculture-dependent.
Estimate
monthly income from all sources
Source:
survey 2015
Figure
9: Showing the estimate monthly income from all sources from the respondent
Figure 9: The data
clearly show that 54.0% of the respondents’ monthly source of income is less
than equal to 50,000-250,000 Leone. 34.0% of the respondents’ monthly source of
income is less than equal to 0-40,000 Leone and 12% of the respondents’ monthly
source of income is less than equal to 300,000-700,000 Leone.
Duration of staying in this community in the
study area
Source:
survey 2015
Figure
10: Showing the Duration of staying in this community in the study area
Figure 11: The
data clearly show that 56.0% of the respondent that has to stay in this
community represent 1 to 15 years, 24% of the respondent that has to stay in
this community represents 16 to 30 years, 11.3% of the respondent that has to
stay in this community represent 31 to 45 years, 8.0% of the respondent that
has to stay in this community represent 46 to 60 years and 7.0% of the
respondent that has to stay in this community represent 61year above.
Status in the community
Source:
survey 2015
Figure
11: Showing the Status of household head in the study area
Figure 11: The
data clearly show that 13.3.0% of the respondent are elders that harvest
fuelwood in the study area, 38% of the respondent are Adult that harvest
fuelwood in the study area, 38% of the respondent are also youth that harvest
fuelwood in the study area, 10% of the respondent are chiefs that harvest
fuelwood in the study area
The extent of fuelwood harvesting in the study
area
Reason for harvesting fuelwood for firewood
Source:
Survey 2015
Figure
12: Showing the reason for harvesting fuelwood for firewood in the study area
Figure 12: show
that 98.7.0% of the respondent interviewed say Yes they harvest fuelwood for
firewood in the study area and 1.3% of the respondent interviewed say No they
do not harvest fuelwood for firewood in the study area.
Reason
for harvesting fuelwood for charcoal
Source:
Survey 2015
Figure
13: Showing the reason for harvesting fuelwood for charcoal in the study area
Figure 13: show
that 34.0.0% of the respondent interviewed say Yes they harvest fuelwood for
charcoal in the study area and 66.0% of the respondent interviewed say No they
do not harvest fuelwood for firewood in the study area.
Reason for harvesting fuelwood for timber
Source:
Survey 2015
Figure
14: Showing the reason for harvesting fuelwood for timber in the study area
Figure 14: shows
that 10.7% of the respondent interviewed say Yes they harvest fuelwood for
timber in the study area and 89.3% of the respondent interviewed say No they do
not harvest fuelwood for timber in the study area.
Reason
for harvesting fuelwood for pole
Source:
Survey 2015
Figure
15: Showing the reason for harvesting fuelwood for poles in the study area
Figure 15: shows
that 40.7% of the respondent interviewed say yes they harvest fuelwood for
poles in the study area and 59.3% of the respondents interviewed say No they do
not harvest fuelwood for poles in the study area.
Reason
for harvesting fuelwood for other (specify)
Source:
Survey 2015
Figure
16: Showing the reason for harvesting fuelwood for other (specify) in the study
area
Figure 16: shows
that 100.0% of the respondent interviewed says no they do not have any other
reason for harvesting fuelwood in the study area.
Why
do you harvest for sale only
Source:
Survey 2015
Figure
17: Showing why they harvesting fuelwood for sale only in the study area
Figure 17: show
that 4.0% of the respondent interviewed say yes they harvest fuelwood for sale
only in the study area and 96.0% of the respondents interviewed say No they do
not harvest fuelwood for sale only in the study area.
Why do you harvest for domestic use only
Source:
Survey 2015
Figure
18: Showing why they harvesting fuelwood for domestic use only in the study
area
Figure 18: shows
that 57.3% of the respondent interviewed say yes they harvest fuelwood for
domestic use only in the study area and 42.7% of the respondents interviewed
say No they do not harvest fuelwood for domestic use only in the study area.
Why do you harvest for both use only
Source:
Survey 2015
Figure
19: Showing why they harvesting fuelwood for both (sale and domestic use only)
in the study area
Figure 19: shows
that 40.0% of the respondent interviewed say yes they harvest fuelwood for sale
and domestic use only in the study area and 60.0% of the respondents
interviewed say No they do not harvest fuelwood for sale and domestic use only
in the study area.
How long have you been engaged in fuelwood
harvesting?
Source:
Survey 2015
Figure
20: Showing how long have you been engaged in fuelwood harvesting in the study
area
Figure 20: The
data clearly show that 66.0% of the respondent that have engaged in fuelwood
harvesting represents 1 to 15 years, 23.3% of the respondent that have engaged
in fuelwood harvesting represents 16 to 30 years, 6.7% of the respondent that
have engaged in fuelwood harvesting represents 31 to 45 years, 3.3% of the
respondent that have to engage in fuelwood harvesting represent- 46 to 60 years
and 7.0% of the respondent that have engaged in fuelwood harvesting represent
61year.
How often do you harvest fuelwood per week for
firewood?
Source:
Survey 2015
Figure
21: Showing how often you harvest fuelwood per week for firewood in the study
area
Figure 21: The
data clearly show that 53.3% of the respondent often harvest fuelwood per week
for firewood represent 7 times, 18.7% of the respondent often harvest fuelwood
per week for firewood represent 1 time, 8.0% of the respondent often harvest
fuelwood per week for firewood represent 2 times, 15.3% of the respondent that
have to engage in fuelwood harvesting for firewood represent 3 times,7% of the respondent often harvest fuelwood per
week for firewood represent 4 times,7% of the respondent often harvest fuelwood
per week for firewood represent 5 times and 3.3% of the respondent often harvest fuelwood per
week for firewood represent 0 times.
How often do you harvest fuelwood per week for
timber?
Source:
Survey 2015
Figure
22: Showing how often you harvest fuelwood per week for timber in the study
area
Figure 22: The
data clearly show that 88.7% of the respondent often harvest fuelwood per week
for timber represent 0 times, 10.0% of the respondent often harvest fuelwood
per week for timber represent 1 time and 1.3% of the respondent often harvest
fuelwood per week for timber represent 3 times. How often do
you harvest fuelwood per week for charcoal?
Source:
Survey 2015
Figure
23: Showing how often you harvest fuelwood per week for timber in the study
area
Figure 23: The
data clearly show that 68.7% of the respondent often harvest fuelwood per week
for charcoal represent 0 times, 28.0% of the respondent often harvest fuelwood
per week for charcoal represent 1 time and 7% of the respondent often harvest
fuelwood per week for timber represent 4 times. 7% % of the respondent often
harvests fuelwood per week for charcoal represent 5 times and 1.3% % of the
respondent often harvests fuelwood per week for timber represent 7 times.
How often do you harvest fuelwood per week for
pole?
Source:
Survey 2015
Figure
24: Showing how often you harvest fuelwood per week for pole in the study area
Figure 24: The
data clearly show that 63.7% of the respondent often harvest fuelwood per week
for pole represent 0 times, 33.3% of the respondent often harvest fuelwood per
week for pole represent 1 time, 2.7% of the respondent often harvest fuelwood
per week for pole represent 2 times, 7% of the respondent that have engaged in
fuelwood harvesting per week for pole represent 3 times and 7% of the
respondent often harvest fuelwood per week for pole represent 7 times.
The
average quantity of fuelwood harvest in one go for firewood
Source:
survey 2015
Figure
25: Showing the Average quantities of fuelwood harvest in one go in the study
area
Figure 25: The
data clearly show that 20.0% of the respondent average quantities of fuelwood
harvest in one go is less than equal to 0kg to 10kg. 30.0% of the respondent
average quantity of fuelwood harvest in one go is less than equal to 11kg to
20kg, 34% average quantity of fuelwood harvest in one go is less than equal to
21kg to 30kg,14.0% average quantity of fuelwood harvest in one go is less than
equal to 31kg to 40kg,7% average quantity of fuelwood harvest in one go is less
than equal to 41 kg to 50kg and 1.3% average quantity of fuelwood harvest in
one go is less than equal to 51kg above
Source:
survey 2015
Figure
26: Showing the Average quantities of timber harvest in one go in the study
area
Figure 26: The
data clearly show that 89.3% of the
respondent average quantities of timber harvest in one go is less than equal to
0kg to 10kg, 7% of the respondent average quantity of timber harvest in one go
is less than equal to 11kg to 20kg, 3.3% average quantity of timber harvest in
one go is less than equal to 21kg to 30kg,5.1% average quantity of timber
harvest in one go is less than equal to 41 kg to 50kg and 1.3% quantity of
fuelwood harvest in one go is less than equal to 51kg above.
The average quantity of fuelwood harvest in
one go for Charcoal
Source:
survey 2015
Figure
27: Showing the Average quantities of charcoal harvest in one go in the study
area
Figure 27: The
data clearly show that 66.0% of the respondent average quantities of timber
harvest in one go is less than equal to 0kg to 10kg, 4.7% average quantity of
timber harvest in one go is less than equal to 21kg to 30kg, 23.3% average quantity
of timber harvest in one go is less than equal to 41 kg to 50kg and 4.0% quantity
of fuelwood harvest in one go is less than equal to 51kg above.
The average quantity of fuelwood harvest in
one go for pole
Source:
survey 2015
Figure
28: Showing the Average quantities of pole harvest in one go in the study area
Figure 28: The
data clearly show that 63.3% of the respondent average quantities of pole
harvest in one go is less than equal to 0kg to 10kg. 1.3% of the respondent
average quantity of pole harvest in one go is less than equal to 11kg to 20kg,
8.0% average quantity of pole harvest in one go is less than equal to 21kg to
30kg,22.0% average quantity of pole harvest in one go is less than equal to
31kg to 40kg,4.0% average quantity of fuelwood harvest in one go is less than
equal to 41 kg to 50kg and 7% average quantity of fuelwood harvest in one go is
less than equal to 51kg above.
4.2.18.
What is the cost per unit of fuelwood harvested for firewood?
Source:
Survey 2015
Figure
29: showing the cost per unit of fuelwood harvested for firewood
Figure 29: out of
the percentage of the household head that belong in the study area 7% of them
sell fuelwood as firewood at 1000 Leone,2.7% at 2000 Leone,5.3% at 3000 Leone,
7% at 4000 Leone,12.7% at 5000 Leone and 78.0% of them do not harvest fuelwood
for sell.
What is the cost per unit of fuelwood
harvested for timber?
Source:
Survey 2015
Figure
30: showing the cost per unit of fuelwood harvested for timber
Figure 30: out of
the percentage of the household head that belongs in the study area 7% of them
sell fuelwood as timber at 7000 Leone,3.3% at 15000 Leone,3.3 at 25000 Leone,
and 92.7.0% of them do not harvest timber for sell.
What
is the cost per unit of fuelwood harvested for charcoal?
Source:
Survey 2015
Figure
31: showing the cost per unit of fuelwood harvested for charcoal
Figure 31: out of
the percentage of the household head that belong in the study area 7% of them
sell fuelwood as firewood at 5000 Leone per bag, 3.3% at 7000 Leone per bag,
2.0% at 8000 Leone per bag, 16.7% at 10000 Leone per bag, 6.0% at 12000 Leone
per bag, 7% at 13000 Leone per bag,7% at 15000 Leone per bag and 70.0% of them
do not harvest fuelwood for charcoal for sell.
What is the cost per unit of fuelwood
harvested for pole
Source:
Survey 2015
Figure
32: showing the cost per unit of fuelwood harvested for pole
Figure 32: out of
the percentage of the household head that belong in the study area 7% of them
sell fuelwood as a pole at 3000 Leone per bunch, 7% at 5000 Leone per
bunch,7.0% at 7000 Leone per bunch, 7.0% at 9000 Leone per bunch,12.0% at 10000
Leone per bag and 84.0% of them do not harvest fuelwood as a pole for sell.
Estimate time spent to travel from your
resident to the place you harvested fuel wood when you started the business.
Source:
Survey 2015
Figure
33: showing the Estimate time spent to travel from the resident of the
respondents’ to the place they are harvesting fuelwood when they started the
business.
Figure 33: tell us
that they spent a total time of 1297 minutes when they started the business to
harvest fuelwood.
Estimate time spent now to travel from your
resident to the place you harvested fuelwood.
Source:
Survey 2015
Figure
34: showing the Estimate time spent now to travel from the resident of the
respondents’ to the place they are harvesting fuelwood.
Figure 34: tell us
that they spent a total time of 1975 minutes now to travel to the place they
harvest fuelwood.
Out of the proportion of fuelwood that you
harvest estimate the proportion by the use you make of it for firewood for
sale.
Source:
Survey 2015
Figure
35: showing the proportion of fuelwood that they harvest, estimate the
proportion by the use you make of it for sale for firewood.
Figure 35: out of
the proportion by use 72.7.0% of the household head put 0 to 20 bunch for sale
for firewood,7% put 21 to 40 bunch for sale,7% put 41 to 60 bunch for sale and
7% put 81 to 100 bunch for sale.
Out
of the proportion of fuelwood that you harvest estimate the proportion by the
use you make of it for charcoal for sale.
Source:
Survey 2015
Figure
36: showing the proportion of fuelwood that they harvest, estimate the
proportion by the use you make of it for sale for charcoal.
Figure 36: out of
the proportion by using 81.3% of the household head put 0 to 20 bunches for
sale for timber, 7.3% put 21 to 40 bunches for sale, 7.3% put 41 to 60 bunches
for sale and 4.0% put 61 to 80 bunches for sale.
Out of the proportion of fuelwood that you
harvest estimate the proportion by the use you make of it for timber for sale.
Source:
Survey 2015
Figure
37: showing the proportion of fuelwood that they harvest, estimate the
proportion by the use you make of it for sale for timber.
Figure 37: out of
the proportion by using 96.0% of the household head put 0 to 20 bunches for
sale for timber, 2.0% put 21 to 40 bunches for sale and2.0% put 41 to 60.
Out of the proportion of fuelwood that you
harvest estimate the proportion by the use you make of it for the pole for
sale.
Source:
Survey 2015
Figure
38: showing the proportion of fuelwood that they harvest, estimate the
proportion by the use you make of it for sale for pole.
Figure 38: out of
the proportion by using 99.0% of the household head put 0 to 20 bunches for
sale for pole and 7% put 81 to 100 bunches for sale.
Out
of the proportion of fuelwood that you harvest estimate the proportion by the
use you make of it for firewood for household use.
Source:
Survey 2015
Figure
39: showing the proportion of fuelwood that they harvest, estimate the
proportion by the use you make of it for the household for firewood.
Figure 39: out of
the proportion by using 99.3% of the household head put 0 to 20 bunches for
household use as firewood and 7% put 21 to 40 bunches for household as
firewood.
Out
of the proportion of fuelwood that you harvest estimate the proportion by the
use you make of it for charcoal for household use.
Source:
Survey 2015
Figure
40: showing the proportion of fuelwood that they harvest, estimate the
proportion by the use you make of it for the household for charcoal.
Figure 40: out of
the proportion by using 99.3% of the household head put 0 to 20 bunches for
household use as charcoal and 7% put 81 to 100 bunches for household as
charcoal.
Out
of the proportion of fuelwood that you harvest estimate the proportion by the
use you make of it for timber for household use.
Source:
Survey 2015
Figure
41: showing the proportion of fuelwood that they harvest, estimate the
proportion by the use you make of it for the household for timber.
Figure 41: out of
the proportion by using 99.3% of the household head put 0 to 20 for household
use as timber and 7% put 81 to 100 bunches for household as timber.
Out of the proportion of fuelwood that you
harvest estimate the proportion by the use you make of it for the pole for
household use.
Source:
Survey 2015
Figure
42: showing the proportion of fuelwood that they harvest, estimate the
proportion by the use you make of it for the household for charcoal.
Figure 42: out of
the proportion by using 98.0% of the household head put 0 to 20 bunches for
household use as a pole, 7% put 21 to 40 bunches for household as a pole and
1.3% put 81 to 100 bunches.
Out
of the proportion of fuelwood that you harvest estimate the proportion by the
use you make of it for firewood for project return.
Source:
Survey 2015
Figure
43: showing the proportion of fuelwood that they harvest, estimate the
proportion by the use you make of it for firewood for project return.
Figure 43: out of
the proportion by using 100% of the household head did not make use of it on
project return.
Out
of the proportion of fuelwood that you harvest estimate the proportion by the
use you make of it for charcoal for project return.
Source:
Survey 2015
Figure
44: showing the proportion of fuelwood that they harvest, estimate the
proportion by the use you make of it for charcoal for project return.
Figure 44: out of
the proportion by using 100% of the household head did not make use of it on
project return
Out of the proportion of fuelwood that you
harvest estimate the proportion by the use you make of it for timber for
project return.
Source:
Survey 2015
Figure
45: showing the proportion of fuelwood that they harvest, estimate the
proportion by the use you make of it for timber for project return.
Figure 45: out of
the proportion by using 100% of the household head did not make use of it on
project return.
Out of the proportion of fuelwood that you
harvest estimate the proportion by the use you make of it for the pole for project
return.
Source:
Survey 2015
Figure
46: showing the proportion of fuelwood that they harvest, estimate the
proportion by the use you make of it for the pole for project return.
Figure 46: out of
the proportion by using 100% of the household head did not make use of it on
project return.
KNOWLEDGE OF RURAL HOUSEHOLD ON CLIMATE CHANGE
4.3.1.
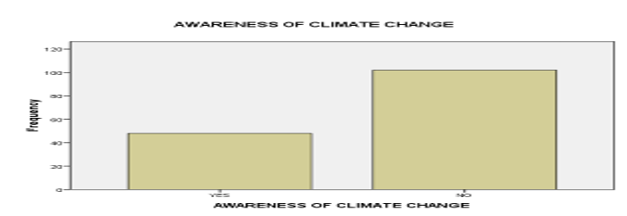
Have ever heard about the expression of climate change.
Source:
Survey 2015
Figure
47: showing the level of their knowledge about expression climate change.
From the figure
above 32% of the respondents say yes they are aware of the expression climate
change and 68% say NO they are not aware of the expression climate change.
Expression of climate change
Source:
survey 2015
Figure
48: showing the test result of their knowledge about the expression of climate
change.
From the figure
above it clearly, show that the respondents level of understanding about
climate change is very poor
Effect of climate change in your environment
Source:
Survey 2015
Figure
49: showing the effect of climate change in the environment.
Figure 49: show
that climate change has a high effect on the time of planting and low effect on
flooding.
Household
access to extension services
Extension in your community
Source:
Survey 2015
Figure
50: showing if there is an extension in the community.
Figure 50: shows
that 36.0% of the respondent interviewed says yes there is an extension in
their environment and 64.0% of the respondents interviewed say No there is no
extension in their environment.
How often do you access extension in your
community?
Source:
Survey 2015
Figure
51: showing how often they access extension in the community.
Figure 51: show
that 7.0% of the respondent interviewed says daily,4.7% says weekly,9.7% says
monthly,20.7% says yearly and 64% says is not applicable because there is no
extension in their community
The format which they access extension
services?
Source:
Survey 2015
Figure
52: showing the form in which they access extension service in the community.
Figure 52: shows
that 2.7% of the respondent interviewed says the video, 1.3 % says radio, 2.0%
says a mobile phone, 4.0% says printed material, 7.3% says seminar, 18% says
other (Oral) and 64.7% say not applicable because there is no extension in
their community.
The focus of the discussion with the extension
services climate change-related issue.
Source:
Survey 2015
Figure
53: showing the focus of the discussion with the extension service.
Figure 53
shows that the focus of discussion with extension workers in the production and
farm-based organization and there is a low focus on climate change.
Discussion
of the major finding
Characteristics
of rural households
The result on gender
revealed that women still lag behind their male counterparts in the development
initiative in the study area. Such a situation may expose a woman to make very
little decisions in the development policies. this agrees with world bank(2003)
finding which stated that though woman produces two-thirds of the food crops,
yet men, and not a woman make the key farm management decision, sadly, female
household head in Sierra Leone are among the voiceless especially concerning
influencing agriculture policies which are aimed at increasing food security
and food production, tend to either underestimate or ignore woman’s role in
both production and the general decision-making within the household.
The result of the study
showed that there are more adult people engage in fuelwood harvesting. The majority
of the respondent were married, this implies that the tendency of fuelwood
harvesting is greater because the married couple was mostly contacted. The
study revealed that the majority of the household head did not attend school,
and those who were fortunate to attain a low level of education, this low level
of education will affect their attitude and desire for adopting innovation.
This study also did not agree with Rogers 2003, who found out that education
has the potential to increase their level of understanding about the effect of
climate change. According to the studies, the majority were household heads of
their family and this implies that the majority of the respondents were married
couples and it shows a sense of responsibility for the taking into cognizance
to new knowledge and hence the tendency for adoption. The majority of the
respondent have a family size of 8-13 persons. But mussel et.al (2001) reported
no significant change relationship between household size and adoption. On the
contrary, the study carried out by Shibah et al (2001) found a statistically
significant positive relationship between the two variables, this implies that an
increase in household size would lead to an increase in the adoption of
knowledge. From the findings of this study, the main source of income for the majority
of the people in the study area is fuelwood harvesting and combination with
Agriculture. This study confirmed Kaidanehs’s (1993) findings that Agriculture
is the main occupation and source of income for the rural populace in Sierra
Leone. This means that through agriculture there are lots of benefits gains if
at all we take the career very seriously.It was also finding out that there
estimate monthly income ranges between fifty thousand to two hundred and fifty
thousand Leone.
From the finding of this
study, most of the household head has spent almost fifteen years in their
community and 38% of them are youth and Adult.
The
extent of fuelwood harvesting
Out of the five reasons
for fuelwood harvesting introduced (firewood, charcoal, timber, poles, and
other species). As presented in figures the majority of the households head
harvested fuelwood for firewood. And most of the harvest the fuelwood for
domestics use only as there is no other source of fuel for domestics use in
their community. From the finding, most of them have to live in their community
for several years and they depend on fuelwood harvesting.
According to the study, the
majority of the household head harvest fuelwood for firewood every day, for
timber not too common, for charcoal and pole same it not too common for them.
From the findings the
average quantity of fuelwood harvest for firewood in one goes is 21 to 30kg for
timber 51kg, charcoal 41kg to 50kg and pole is 31kg to 40kg.
From the finding, on the
average households are spending 11 more minutes rep trip now to collect
fuelwood, this shows that deforestation is on the rise. Out of the proportion
by using most of the household head use fuelwood for domestic purposes.
Knowledge
of rural household on climate change
Innovation usually brings
with some degree of benefit to its potential adopters but it’s equally created
some kind of uncertainties in the mind of adopters(Rogers,1995).from the study
there are a lot of benefits if the people knowledge of climate change is well
explained to them but almost half of the total population have never heard
about the expression climate change and the effect it cause in the environment.
Even doe there is a low extension officer in their community their focus of
discussion is not meanly on climate change.
Household
Access extension services
As extension has a great
role to play in people living in the community so it must be available but from
the finding of this study, only very few communities have an extension and the
access to it is not available the time they need it most.
According to the study, a
large number of the total population comment that when rating the extension
services that they receive they said it inadequate even nit applicable to them
because there is no extension in their community.
SUMMARY, CONCLUSION, AND
RECOMMENDATION
Summary
The
overall objective of the study was to assess the effect of fuelwood harvesting
on the livelihood of rural households in Moyamba District, Southern Sierra
Leone. The specific objectives are to To describe the Characteristics of rural
households that depend on fuelwood harvesting in the research area, determine the extent of fuelwood harvesting
among households in the research area, assess the Knowledge of rural household
on climate and Extent to which household access extension services in the
research area. The study was limited in scope, instrument, the sample of
household head, and study area. It was mainly limited to Kori, Kamejei, and
lower Banta chiefdoms as there is a massive production of fuelwood harvesting
in this area. Data collection mainly targeted household heads.
Undertaking the study, a survey research
design was adopted based on which a standard questionnaire was developed. The
population for this study targeted all males and females those are household
heads in these chiefdoms estimated to be around 5,000 household heads. The
sample size for this study was determined based on Yamane (1967) sample size
determination procedure. A two-stage sampling technique was carried out to
select the sample respondents. The first stage was a purposive selection of the
project areas (areas mostly harvest fuelwood). The second stage was also the
selection of respondents. A simple random sample technique was used to select a
total number of hundred and fifty (150) household heads as the sample for the
study. A survey questionnaire was chosen for the collection of information from
the farmers for this study to achieve the study objectives.
The instrument was administered to the farers
by the researcher himself alongside (2) trained enumerators (extension agents).
The data collected was entered and analyzed
by simple descriptive analysis and simple linear regression tests using
statistical package for social scientists (SPSS). The descriptive statistics
involving the use of frequencies and percentages were used to summarize the
data.
The major findings of this study include.
Male household head dominates fuelwood harvesting in the study area, between
age brackets 26 to 46years this presents the active group in fuelwood
harvesting,82.7% of the respondents were married,50.0% of the respondents did
not go to school at all, also 55.3% of them were household heads, with the
highest household size ranging from 8-13 people, from the study it is showed
that majority of the household heads practice farming and fuelwood harvesting
as their main source of income with a percentage of 90.0%.
From the study, majority of the household
hold head harvest fuelwood for firewood and it mainly for domestics’ purpose
and it is a daily job for them to harvest firewood with an average quantity
ranging between 21kg to 30kg and they lack the knowledge of the effect of
climate change in their environment.
There is no significant relationship between
extension service to the household head and the effect of fuelwood harvesting
on the livelihood of rural households in the moyamba district.
Conclusion
Based on the findings of the study, the following conclusions are
drawn:
Male household heads dominate fuelwood harvesting in the study area,
indicating that women are being relegated to the background in the fuelwood
harvesting system.
Majority of the household head were within the age bracket of 26 to
46 years, stating that there are more active members engaged in fuelwood
harvesting and therefore need support from Government and other donor agencies
to aid their Agricultural activities and deviate from fuelwood harvesting to be
able to feed their families since most of them were married and have the
tendency to adapt to new knowledge about the effect of climate change in their
environment. Those who were not educated completely dominated among the
respondent that are were interviewed this shows that the awareness and adoption
of innovations are affected by the literacy status of household heads. There is
an increase in the number of household head and household size of 8-13 people tend
the adoption of new knowledge about the effect of fuelwood harvesting. From the
study majority of the respondents, practice farming and fuelwood harvesting as
their main source of income and this depicted that household head if supported
there would be increased in the production of Agricultural produce because it
will stop them not to do fuelwood harvesting.
According to the data, the preferences of the household heads are to
improve their knowledge in the effect of climate change in their environment
and each community should access extension services in their environment. There
are a lot of constraints faced therefore effort is needed to assist these
household heads to promote higher production of crops and to stop them from
fuelwood harvesting.
Recommendations
After the conclusion drawn from this study, the following are some of
the recommendations;
The study recommends that extension
workers should receive training on climate change-related issues. Besides,
other alternatives for cooking should be made available to rural households.
There is no strong relationship between
regular extension visit and training but the study revealed that the seldom
visit of extension agents to the study area gives a clear indication that
extension agents/services were not playing their roles in promoting agriculture
and help the people to stop fuelwood harvesting in the study area. The study
recommends that regular visitor contact with extension services provide an opportunity
for transfer of skills, knowledge of climate change, and other information
which discourages them from fuelwood harvesting.
According to what the study revealed, the
excess harvesting of fuelwood is faced as a result of inaccessibility to another
source of fuel for their domestic purposes, therefore the study demanded the
government, stakeholder and donor agency join together and bring up another
means of fuel that household will use for domestics purpose.
Government and
stakeholder should encourage men as well as woman participation in the fight
against climate change and also increase the extension contact and
participation in handling this problem in the world
REFERENCES
Adebajo Oyefunke
Ooyemi(2012).Effect of Family Size on Household Food Security in Ogun State, Nigeria.Department
of Agricultural Economic Extension.Ladoke Akintala University of Technology,
Ogbomosho Nigeria.Vol 2 No 2,pp 137-138
Aruna
Agrawal(2008). The role of local institutions in the adoption of climate
change. A paper prepared for social dimensions of climate change, social
development department world bank.pp 9-31
Bernard
Chazovachii, Leonard Chitongo, and Jenias Ndava, (2013).Reducing urban poverty
through fuelwood business in Masvingo city, zimbabwe. Bangladesh e-journal of
sociology volume 10 number 1 .p 60
Canberra Group Hand Book on Household Income
Statistics, Second Edition. Pp 6-17
Dr .M.Khata Jabor
et al (2011) Does Parent Educational Status Matter on the Students Achievement
in Science. International Conference on Social Science and Humanity, Lacsit
Press Singapore Vol.5 pp 309-310
.D.
Kupter(Germany, fed Rep) and R. Koriman Zira (zimbabwe),(1990). Agriculture,
Forestry and other Human activities pp 77-78
F.E.Ebe,(,2014).
The sources, distribution channel, and market structure of fuelwood in Enugu
state, Nigeria. Journal of economics and finance volume 5 issue 6 p30.
Francis Libois and
Vincent Sumville(2014) Fertility, household size, and poverty in Nepal.CMI
working paper.vol 4.pp 5-14
Jonah. M.
Fogel,(2013).Collaborative interface modeling of fuelwood harvesting practices.
Residential NIPF landowners of the Jefferson national forest wildland-urban
interface, Montgomery country Virginia.
Kyle .W. Knight and Eugene .A. Rosa,(2014).
Household dynamic and fuelwood consumption in developing countries: a
cross-national analysis.p378.
Kampal Sinha(2005)
Household characteristics and calorie intake in rural India. Quantile Regression Approach.the Australian national
university.pp2-23.
Linda.C.Gallo et
al(2003).Martial Status and Quality in Middle Age Woman.Association with Levels
and Trajectories of Cardiovascular Risk
Factors.America Psychological Association Inc.Vol 22.pp 453-463
M. Arnold and
R.persson(2003). Reassessing the fuelwood situation in developing countries.
International forest review Swedish University of Agricultural Sciences Department
of forest product and market.p.o.box 7060,75007 Uppsala, Sweden pp 379.
Matt Barnes and
Abigail McKnight et al (2014). Understanding the Behaviours of Household Influence
Poverty. A Review of Research Evidence, Department of Energy, and Climate
Change.Nat Social Research.
Mohammed.B.T and
Abdulguadri.A.F(2013).Comparative Analysis of Gender Involvement in
Agricultural Production and Agricultural Economic Vol 4(8), pp 240-244
O.A Oni and S.A.Yusuf(2007). Determinants of expected poverty among rural households in Nigeria.Department of Agricultural Economics, University of Ibadan.Ibadan Nigeria. Paul Munro(2011).The Domestic Trade in Timber and Fuelwood product in Sierra Leone.pp 6
The study was to assess
post-distribution livelihood analysis on landslide emergency response in Sierra Leone, with the following are the objectives of the
post-distribution monitoring survey to describe the characteristics of the
household head, Situation of children in the household, The rate at which the
household head shelter was destroyed, Household head livelihoods and The
feedbacks from the household heads towards the project. The sample size for
this study was determined based on Yamane (1967) sample size determination
procedure. Using this procedure, a total of 150 household head was selected
from the total population. The sample was randomly selected for the survey.
After cleaning the data at a 5% degree of accuracy/margin of error 132 was
analyzed. Based on the findings of the study, the following conclusions are
drawn: the study reveals that Female households dominate as the most vulnerable
people in the study area, indicating that women play essential rule in the
sustainability of the house. The majority of the household head were within the
age bracket of 25 to 59 years, stating that there are more active members
engaged in supporting the livelihood for each household. It also stated clearly
that most of the household was led by a single woman and the situation of
children in the household categorical sate that for the school level most of
the children are in have a primary school and in good health condition they
also need protection. The data also stated clearly that all the targeted
beneficiaries were affected by the flood/landslide and their properties are
destroyed. The data also shows that before the landslide they have income-generating
activities but now it was destroyed activity. Majority of the household head
know what is child protection and most of them stated that the major risks
their children are currently facing are economic exploitation
On 14th August 2017 Sierra Leone Capital City
Freetown expérience one of the most recent heavy rainfall. Three days of heavy
rains triggered flash floods and a massive landslide in and around the capital
Freetown, Sierra leone. The most severe disaster occurred in Regent and Lumley
community with a massive 6 kilometers mudslide submerging and wiping out over
300 houses along the banks of the Juba River. Flash floods also affected at
least four other communities in other parts of Freetown.
The UNDAC situation update as of August 25th
reported a total of 496 fatalities and roughly 800 missing persons. The Office
of National Security (ONS) the organization in charge of the coordination of
the humanitarian response, list 5962 individuals (1424 households) in five
communities as being directly affected by flood or landslide affected areas,
referring to the following categorization:
Survivors
whose homes have been rendered either temporarily or permanently
uninhabitable
Households
who have lost income generating member(s)
Research Objectives
The following are the objectives of the post-distribution
monitoring survey
To
describe the characteristics of the household head
The situation
of children in the household
The
rate at which the household head shelter was destroyed
Household
head livelihoods
The
feedbacks from the household heads towards the project
Methodology
Sample
The sample size for this study was determined to
base on Yamane’s (1967) sample size determination procedure. Using this
procedure, a total of 150 household head was selected from the total
population. The sample was randomly selected for the survey. After cleaning the
data at 5% degree of accuracy/margin of error 132 was analyzed
Data collection, entry and analysis
A survey questionnaire was developed. The
Survey questionnaire was chosen for the collection of information from the
household heads to achieve the objectives. The preferred questionnaire because
of the ease of administration and scoring. Four enumerators were hired to
conduct the Survey when the 200 household heads came to collect their packages.
The enumerators were trained and how to interpret the tool. The data collected
was clean, entered, and analyzed by simple descriptive analysis and econometric
models using statistical package for social scientist (SPSS) version 16 soft
were. The software was chosen because it is the most used package for analyzing
Survey data. The software has the following advantages: It can easily be used
to analyze multiple-response questions, cross-section and time series analysis,
and cross-tabulations (i.e. relate two sets of variables) and it can also be
used alongside Microsoft Excel.
Descriptive statistics such as frequency
counts, percentages, proportions, and means were used to analyze the data.
Frequency tables were developed to display the results obtained from the
research analysis
Limits and Challenges
There were limitations encountered during the
study. These were:
Respondent was not will to divulge
information: some respondent is reluctant to respond to the interview schedule
because a lot of their time had been wasted in the past by researchers on
interviews without any perceived benefits.
Getting respondents for questioning it was
also difficult to get the respondent to spear their productive time or leisure
time for questioning. They were either very busy looking out for more support
from other N donors or people. This, therefore, put heavy pressure on data
collection to approximately adjust to the respondents’ daily schedule and
interviews them when it was convenient.
The result of the study is presented and
discussed .the interpretation is based on the set objectives for the cash
transfer. Finding were also explained in the context of related studies.
1.1 Information on the head of household
One of the objectives of the study was to
determine the characteristics of households in juba community
Gender of respondents
Gender may determine what role and woman play
in the development programs in the household. Hence, the gender situation in
the study area was investigated and results are presented below.
Figure 1: Showing
Gender distribution of respondents
Figure 1: shows that 75.8% of the respondent interviewed were female and
24.2% were male .this reveals that in the study area, the female gender is the
highest participants in the household
Age of Respondent
Age is a measure of maturity and determines the
rate of an individual in any society. Literature tends to suggest that it also
determines the adoption capacity of the individual age distribution of
respondent ise
Figure 2: Distribution
of respondents in the study area
Figure 2: shows that the age varies from 18 and 78 years, 11.4% are
between 18 and 24,25 and 59 are 84.1% and 60+ is 4.5%.it is clearing show that
the household heads were in the middle age class. This has a positive bearing
on their ability to sustain their livelihood.
Type of household
Figure 3: type of
household
Figure 3: among the respondent that were interviewed 52.3% were
household lead by a single woman and 47.7% could either be led by a child
(<18), led by a brother /sister 18+, led by a grandparent, led by a
single-woman, led by a biological adult parent, led by an uncle/auntie, led by
a foster parent and if other (specify).
Number of adults in
the household
Figure 4: showing the number
of adult in the household
Figure 4: shows that 36.4% of the respondents had adults between 18-24
years household members with the highest majority, 7.6% of the respondents had
25-59 years household members with the second majority, 1.5% of the respondents
had 60+ and 54.5% said they do not have Adult in their household.
1.2 situation of
children in the household
The situation of
children in the household school level
Figure 5: showing the
situation of children in the household school level
Figure 5 shows that 41.7% of the respondent interviewed said that their
children are in the primary school, 30.3% in the secondary school, 15.2% out of
school and 12.9 is not applicable
Health Situation of children in the household
Figure 6: showing the
health situation of children in the household
Figure 6: showing the
health situation of children in the household
Figure 6: show that 68.9% of the respondent interviewed said that their
children are in good health condition, 28.0% sick, and 3.0% in a critical
situation
Need for protection of
children in the household
Figure 7: the need for
protection of children in the household
Figure 7: show that 67.4% of the respondent interviewed
said yes there is a need for child protection and 32.6% said No there is no
need for child protection
1.3
Shelter
House
has been affected by flood/ the landslide
Figure 8: Showing how
the house been affected by the flood /the landslide
Figure 8: show that all the respondent have been affected by the
flooding /landslide
Figure 9: showing they
answer yes and how much it been affected
Figure
9: show that 77.3% of the respondent said they are total destroyed, 22.0% of
the respondent said they are partially destroyed and 8% said they do not know1.4 Livelihood
1.4 Livelihood
Income-generating
activity before the landslide
Figure 10: showing
income-generating activity before the landslide
Figure 10: shows that 90.9% of the respondent interviewed say Yes they
have an income-generating activity before the landslide and 9.1% of the
respondent interviewed say No they have not had an income-generating activity
before the landslide.
If yes, how much has
it been affected by the landslide
Figure 11: showing
that yes it has been affected by the landslide
Figure 11: the data clearly show that 72.7% of the respondent income-generating
activity is destroyed activity, 20.5% of the respondent reduced activity, 2.3%
of the respondent not affected at all and 4.5% of the respondent said they do
not know
How do you cope if your income generating activity has been completely or partially destroyed?
Figure 12: showing they cope if your income generating activity has been completely or partially destroyed?
Figure 12: shows that 47% of the respondent interview doing business(if
other specify),6.1% working for neighbors,3.8% taking debts,6.1% reducing
number of meals,9.8% reducing food
quantities,16.7% sending children to relatives/neighbors to get support,4.5%
sending children in the street to get food and 6% begging in the street
How much revenue did
you make with your income-generating activity (if any) in the last days?
Figure 13: showing the
revenue make with income-generating activity
Figure13: the data clearly show that 84.8% of the respondent weekly
revenue is between 0,000-10,000 leone.11.4% of the respondent weekly revenue is
between 21,000-30,000 Leone, 8% of the respondent weekly revenue is between
31,000- 40,000leone, 1.5% of the respondent weekly revenue is between
41,000-50,000leone and 1.5% of the respondent weekly revenue is 61,000 Leone
Figure 13: showing the
revenue make with income-generating activity
How well can you
currently cover the essential needs of the household?
Figure14: showing how
well can they currently cover the essential needs of the household
Figure14: the data clearly show that 65.9% of the respondent cover their
essential needs partially, 8.3% of the respondent cover their essential needs
totally, 12.1% of the respondent does not know if their essential needs are
cover and 13.6% respondent not at all.
Revenue expenditure
Figure15: showing the
revenue expenditure
Figure15: show that 68.2% of the respondent interviewed spend their
revenues on food, 9.8% of the respondent spend their revenue on housing, 15.2%
of the respondent spend their revenue on education, 6.8% on other (business)
the likes of health cloth and transportation nothing spent.
Prioritized of
expenditure
Figure16: prioritized
revenue spend
Figure16: show that 96.2% of the respondent interview spend their
rev3.8% on housing.
Received cash
assistance
Figure17: showing if
the received cash assistance since the landslide
Figure17: show that 61.4% of the respondent interviewed say yes they
received cash assistance and 38.6% say no.
If yes, how many much
have you received in total?
Figure 18: showing the
amount of cash received
Figure 18: show that 61.4% of the respondent interviewed received cash
between 0,000,000-1,000,000 Leone, 25.0% of the respondent received cash
between 2,000,000-3,000,000 Leone, 12.9% of the respondent received between
4,000,000-5,000,000 Leone and 8% received 6,000,000-7,000,000 Leone.By
which organization
Figure 19: showing the
organization that provides cash
Figure19: the data clearly show that 47.0% of the respondent received
cash from NACSA, 8% from the street child, 8% from Christian organization and
48.5% show that it is not applicable
How did you use the
cash received
Figure
20: showing how they used the cash received
Figure 20: shows that 21.2% of the respondent
interviewed use their cash received on health issues, 18.2% on food,5.2% on
housing, 3.8% on education, 6.1% on transportation and 31.8% on others ( business)
1.5
FOOD
How
many meals a day households members have per day Adult
Figure 20: showing how
they used the cash received
Figure 20: shows that 21.2% of the respondent interviewed use their cash
received on health issues, 18.2% on food,5.2% on housing, 3.8% on education,
6.1% on transportation, and 31.8% on others ( business).
1.5 FOOD
How many meals a day
households members have per day Adult
Figure21:
showing the meal a day household member have per day Adult
Figure 21: shows that 38.6% of the respondent
interviewed have 3 meals per day, 34.1% of the respondent interviewed received
2 meals per day, 25.0% received 1 meal per day and 2.3% received meal per day.
How
many meals a day households members have per day children
Figure21: showing the
meal a day household member have per day Adult
Figure 21: shows that 38.6% of the respondent interviewed have 3 meals
per day, 34.1% of the respondent interviewed received 2 meals per day, 25.0%
received 1 meal per day and 2.3% received meal per day.
How many meals a day
households members have per day children
Figure22: showing the
meal a day household member have per day child
Figure 21: show 40.9 of the respondent interviewed have 3 meals per day,
34.8% of the respondent interviewed received 2 meals per day, 20.5% received 1
meal per day, and 3.8% received meal per day.
1.6 Intentions
Do you intend to
relocate with your household?
Figure 23: showing the
intention to relocate with their household
Figure23: show that 97.0% of the respondent interviewed said yes they
want to relocate and 3.0% said No
Why do they want to
relocate?
Figure24:
showing the reason why they want to move
Figure24:
show that 59.8% of the respondent interviewed want to move because the place is
not nice, 36.4% said the place is not safe, 8% ask by the government to
relocate and 4% because of health reason
If yes, where
Figure24: showing the
reason why they want to move
Figure24: show that
59.8% of the respondent interviewed want to move because the place is not nice,
36.4% said the place is not safe, 8% ask by the government to relocate and 4%
because of health reason
If yes, where
Figure 25 showing if
they say yes where are they going
Figure25: the data
clearly show that 47.0% of the respondent interview will be moving to a nice
and safe place, 42.4% to a relative, 8.3% to the village and 2.3% to waterloo
community
If you were to receive
cash assistance, what would you use it for in priority for Adults?
Figure 26 showing if
they receive cash assistance, what would use it for in priority for Adult
Figure26: show that
38.6% of the respondents’ interviews use their cash assistance on food for adults,
42.4% on housing, 5.3% on education, 0.8% on clothing, and 12.9% on others like
a business.
If you were to receive
cash assistance, what would you use it for in priority for children?
Figure 27 showing if
they receive cash assistance, what would use it for in priority for children
Figure26: show that
43.9% of the respondent interview use their cash assistance on food for adult,
9.1% on housing, 40.9% on education and 6.1% on health
1.7 Child protection and Recovery awareness
Do you know what child
protection is
Figure 28: showing the
level of awareness on child protection
Figure23: show that
71.2% of the respondent interviewed said yes know what child protection is and
28.8% said No
What are the major
risks you children are currently facing?
Figure 29: showing the
major risk their children are currently facing
Figure29: show that
12.9% of the respondent interviewed said their children are physical abuse,
21.2% psychological abuse, 1.5% sexual abuse, 33.3% economic exploitation, 6.1%
neglect and 25.0% do not know
Figure 30:
beneficiaries’ overall level of satisfaction
Figure 30: the data
clearly stated that the respondent household head interviewed were totally
satisfied.
Based on the findings of the study, the following conclusions are drawn:
Female households dominate as the most vulnerable people in the study
area, indicating that women play an essential rule in the sustainability of the
house.
The majority of the household head were within the age bracket of 25 to
59 years, stating that there are more active members engaged in supporting the
livelihood for each household. It also stated clearly that most of the
household was led by a single woman and the situation of children in the
household categorical sate that for the school level most of the children are
in primary school and in good health condition they also need protection.
The data also stated clearly that all the targeted beneficiaries were
affected by the flood/landslide and their properties are destroyed.
The data also shows that before the landslide they have income-generating
activities but now it was destroyed activity.
The majority of the household head know what is child protection and
most of them stated that the major risks their children are currently facing are
economic exploitation.
According to the data collected the household head were totally
satisfied
Recommendations
After the conclusion drawn from the study, the following are some of the
recommendations:
The study recommends that for
any implementation of such a project there should be an early
collaboration with government officials to avoid time-wasting
According to what revealed
there should be a continues to follow up to our beneficiaries more
especially the children that we did the family tracing and reunification
for.
The government should enforce that the
beneficiary list should be available on time
References
Unicef,21 August 2017.Sierra Leone flood and landslide situation report
NO.4
SOS children village – Sierra leone, September 2017,
ensuring the essential needs of vulnerable crises affected household pp1
Sierra Leone – Rapid damage and
loss assessment of August 14th, 2017 landslides and floods in the western area
(English)
AGAPS,16 August 2017, Sierra Leone
Mudslide and flooding in Greater Freetown
WANEP,15 August 2017, The Sierra
Leone Mudslides and Floods: Implication to Human Security
THE NEED OF STRENGTHING THE AGRICULTURAL HOUSEHOLD DURING AND AFTER CORONA VIRUS OUTBREAK IN SIERRA LEONE
By
PATRICK KARGBO A pandemic/ epidemic has always created a great disaster in world history and most time the agricultural sector in Sierra Leone and by extension to Africa bears the greatest disadvantages in terms of food security and livelihood. Sierra Leone as a country in Africa has a total population of 7.65 million people (World Bank 2018) and our major activities for livelihood are farming, mining, and petty trading. The agricultural sector in Sierra Leone over the years has faced several challenges to achieve food security from the civil war to Ebola now coronavirus. The country has a large acreage of fertile land, water, sunlight to support mass agricultural activities. Due to a lack of good and coherent policy little or nothing had been done to salvage the situation. To date, the country’s staple food which is rice is still imported from Thailand, Vietnam, and Pakistan. This will leave one to wonder what is wrong with us as Sierra Leoneans with all the agricultural potential we have and donor support from EU, world bank, IMF, ISDB, ADB, etc yet we’ve failed to exploit them for the good of all and sundry. Based on the executive summary of the 2015 Population and Housing Census in Sierra Leone. Sierra Leone is still a dominantly agrarian economy with 57.9 percent of households engaged in agricultural production. Out of a total of 732,461 agricultural households nationwide, just 5.5 percent were in paid employment. At the regional level, the Northern region recorded the highest proportion (1.8 percent) of agricultural households in paid employment, with the Western region (0.9 percent) at the bottom. The majority of agricultural households nationwide were in self-employment without employees (76.9 percent). At the regional level, the Northern region again recorded the highest numbers of agricultural households in self-employment, followed this time by the Eastern region, the Southern region, and the Western region. Notwithstanding, as we are fastly approaching planting season and experiencing climate change as drawback factor and the country is most likely heading for lockdown regards the rapid increase of coronavirus cases I may encourage the government of sierra leone to develop a structured scheme( like food for work, high-quality seeds to increase production, etc) as my grandmum from ropolon always told me that empty bag cannot stand it may need support for it to stand no matter the kind support it needs one. Regards all this donor funding going to sierra leone during this trying time this Agricultural scheme will be used as a motivator to our farmers to engage in massive agricultural production to avoid the issue of food shortages during and after these crises.